Words and illustrations by Abbi Hughes
If you aren’t lucky enough to look out of your bedroom window and see the beach then you will need to learn how to predict the swell or at the very least know the right websites to help you find out. Until recently surfers were dependant on long-range weather forecasts and shipping channels to predict swell they might get over the next few days. Fortunately we now have a wide range of online charts that can help and many webcams cropping up over the world, giving us a fantastic live view.
Weather Charts explained
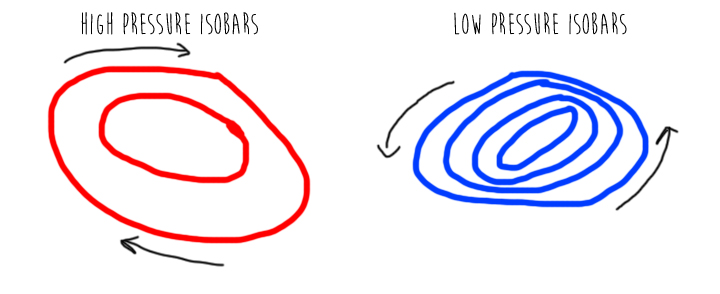
Isobars
 (Original source before adjustments Wikipedia)
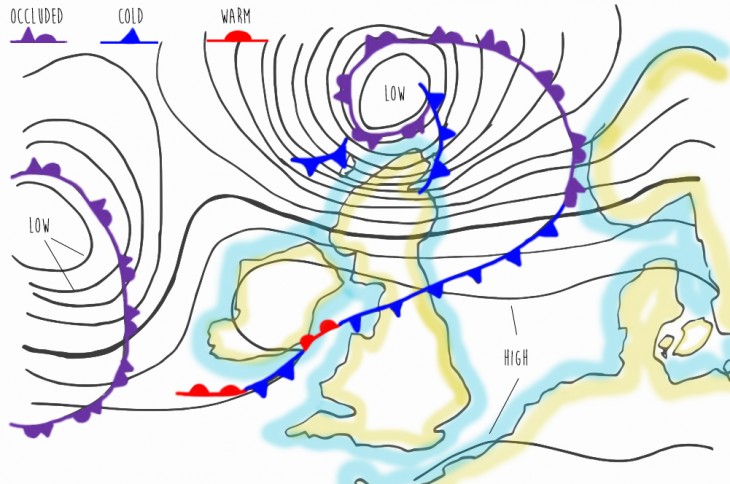
Isobars (represented in black in the image above) are the lines on a weather map. They represent contours’ of atmospheric pressure. The winds run almost parallel to these bars. In previous posts we have talked about wave formation by the wind by low pressure systems (called depressions), these strong winds are displayed by isobars that are very close together and circle in an anti-clockwise direction. High pressure systems or anti-cyclones bring sunny dry weather and light winds, hence not creating much swell for us to surf. This means that in the summer big swells are a little more few and far between and long spells of little waves are the norm.
Below are some of our drawings that show low pressure systems that would produce waves for us surfers (the closer the isobars the windier it is). And high pressure systems of sunny weather, but a severe lack of surf. Commence the tearing of hair out over summer months.
You also get occluded fronts, represented in purple in the hove image. This is where a cold front takes over a warm front or vice versa.
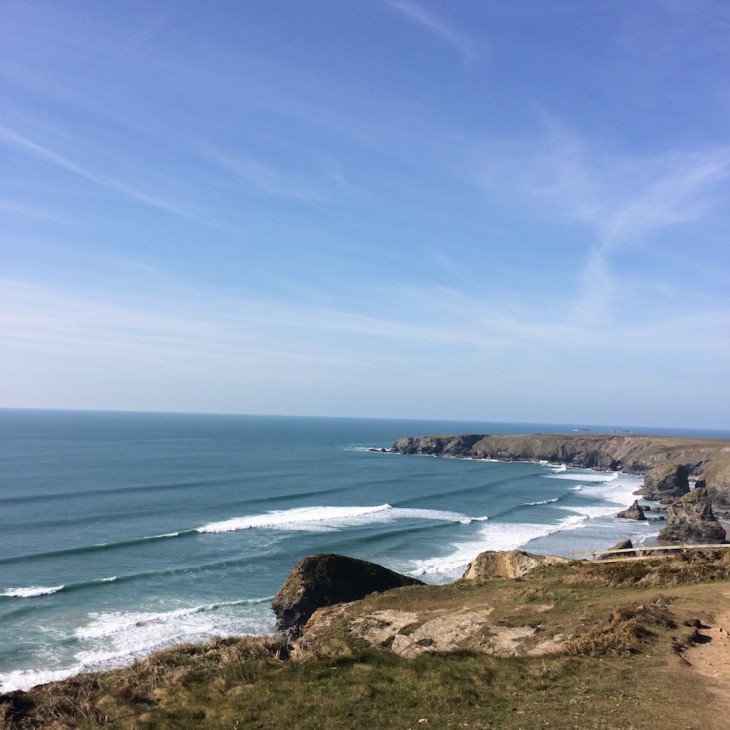
We can also view charts that show both the directions of the swell and wind so we can work out which beaches would have the best conditions for that particular day. It could be as simple as moving to the next cove, or the beach to the left or right to the one you are intending to surf, to get way better conditions for your ability.
Wave height charts work in colours. Light blues and greens tend to mean smaller swells then travelling through the colour spectrum to yellows, pinks, reds and finally blacks showing the largest swells.

I hope this little forecasting taster will let you all get to the right beach at the right time to hit those perfect lines.